
Micro-Benchmarking a RISC-V SBC (CanMV K230)
Development environment courtesy of RISE

In a previous article (more than a year ago), we unpacked Canaan’s CanMV board with a K230 core.

In this post we are going to do some benchmarking on the board.
Since we published the original post, we have discovered a nice presentation by Nathan Egge during the RISC-V 2024 Summit in Europe (youtube video, slides). In this presentation Nathan mentioned the development images that RISE (RISC-V Software Ecosystem) is providing for a few different platforms including QEMU and more interestingly for us: the CanMV board and its K230 SoC. This image has proven to be a really good alternative to the official image we have used previously. It contains a few useful tools to build and run benchmarks and in our experience it has proven more stable when it comes to connecting the board to a network through ethernet.
Rise’s development image for CanMV
You can easily download and burn the image on your favorite SD-card (as usual execute at your own risk !):
wget https://people.videolan.org/~negge/canaan-3G-2024-04-08.img.xz
xz --decompress canaan-3G-2024-04-08.img.xz
sudo dd if=canaan-3G-2024-04-08.img of=<path-to-device> bs=1M oflag=sync
This image is a gentoo distribution with very recent versions of common software tools for RISC-V development. The image comes with two existing users: root and negge (both with rise as the password). More info on the image (and how to run it on QEMU) can be found here.
On my setup, the image has proven more stable and usable than the official images. It provided a ssh server and allowed remote connection and development (no more need to connect to the board through a serial TTY). I still had to setup the date (useful in particular when cloning a git over https since the URL security certificate was appearing has have been created in the future before setting the date properly).
Note: to set the date on the CanMV board, you can executed
date +%son your host machine and executeddate -s @<value>on the CanMV with the given value. There is certainly an automated way to set it (ntp daemon ?) but I did not bother to look further for now.
We connect to the board either through SSH (preferred method as you do not have to use a physical connection between your host and the SBC):
ssh negge@<the-ip-of-the-CanMV> # password is riseor through the serial link as before:
screen /dev/tty.usbmodem<more characters> 115200 RISE image tools
clang version 18.1.3
Target: riscv64-unknown-linux-gnu
Thread model: posix
InstalledDir: /usr/lib/llvm/18/bin
Configuration file: /etc/clang/riscv64-unknown-linux-gnu-clang.cfg
Micro-Benchmarking:
We have extended rvv-examples with a ubench directory which contains a set of instruction and memory transfer micro-benchmarks. The full source code is available here: https://github.com/nibrunie/rvv-examples/tree/v0.3.0-ubench.
We are going to perform 3 different types of benchmarks. The first 2 are going to measure respectively the latency and the throughput of scalar instructions. The last benchmark is a comparison between ISS and hardware measurement for a softmax benchmark we published previously.
Distinguishing latency and throughput is key, in particular because on a CPU implementing RISC-V Vector (and by dependency the scalar instruction set) both scalar latency and vector throughput may be the key metrics. But depending on the workload, scalar throughput and vector latency could also impact application performance noticeably. Those are 4 independent dimensions of an implementation performance measurements worth reporting.
Scalar instruction latency
The first set of benchmarks measures the latency of scalar instructions. The latency is measured by building a chain of dependent instructions. Some assembly widget is used to reset the data between each instruction execution without breaking the dependency chain. The goal of this widget is to ensure that latency is measured with identical data input (in case the micro-architecture optimizes some data values over others).
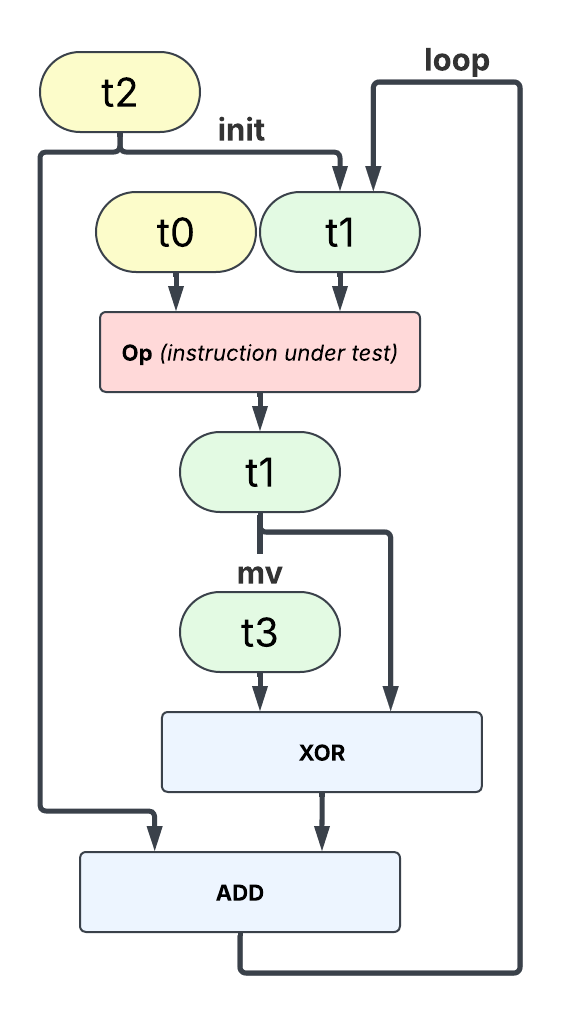
Note: because the input data are always the same, a micro-architecture which implements a data-based result prediction would lead to the micro-benchmark measure the latency of this mechanism rather than the instruction under test.
The result is plotted in the diagram below:
nop (no-operation) and add exhibit a single cycle latency (which corresponds to the origin on the vertical axis). 64-bit multiplication exhibits a 6-cycle latency, and 32-bit mulw exhibits a 5-cycle latency. On the floating-point side, fadd.d and fsub.d have 4-cycle latencies, fmul.d 5-cycle. As expected the division (and remainder) instructions exhibit a longer latencies, up to 25 cycles for a 64-bit integer divide [unsigned], div[u]. We will survey in more details the latency of the division operation, div, in the next section.
Note: the 64-bit
rem,remu,divanddivulatency show some inconsistencies in the previous measurements. It is highly likely for the latency exposed by those operations to be very similar. Those latencies being data dependent, the way inputs are built can have an impact of the latency measured, and a single average latency number contains not that much information for those instructions.
Importance of data values in latency measurements
Some instructions may exhibit a data dependent execution latency, meaning latency varies with operand values.
This must be strictly avoided for instructions used in cryptographic functions (see for example how RISC-V extensions Zkt and Zvkt mandates data independent execution latencies for a key set of scalar (respectively vector) instructions. But for a few select instructions, data values can be exploited to offer interesting speed-up for some subsets of operand values. This is often the case for instructions which relies on an iterative implementation such as integer and floating-point division, integer remainder or floating-point square root operations1. Using an iterative approach to implement those operations, that appear less frequently in an average workload, saves area for more frequent operations.
We have extended our benchmark to be able to execute data-aware measurements: random data with defined property (e.g. bit length) are generated and we evaluate the instruction execution latencies on those specific data values.
The plot below reports an subset of the result for the signed 64-bit division div instructions. It is limited to positive inputs, and plots 5 series with various dividend widths: 2, 16, 32, 48, and 64 bits. The x-axis represents the difference between the position of the most significant bit of the divisor subtracted from the position of the most significant bit of the dividend. This delta is often meaningful for integer division and remainder because it can be exploited to reduce the number of iterations required to compute the full quotient (or remainder).
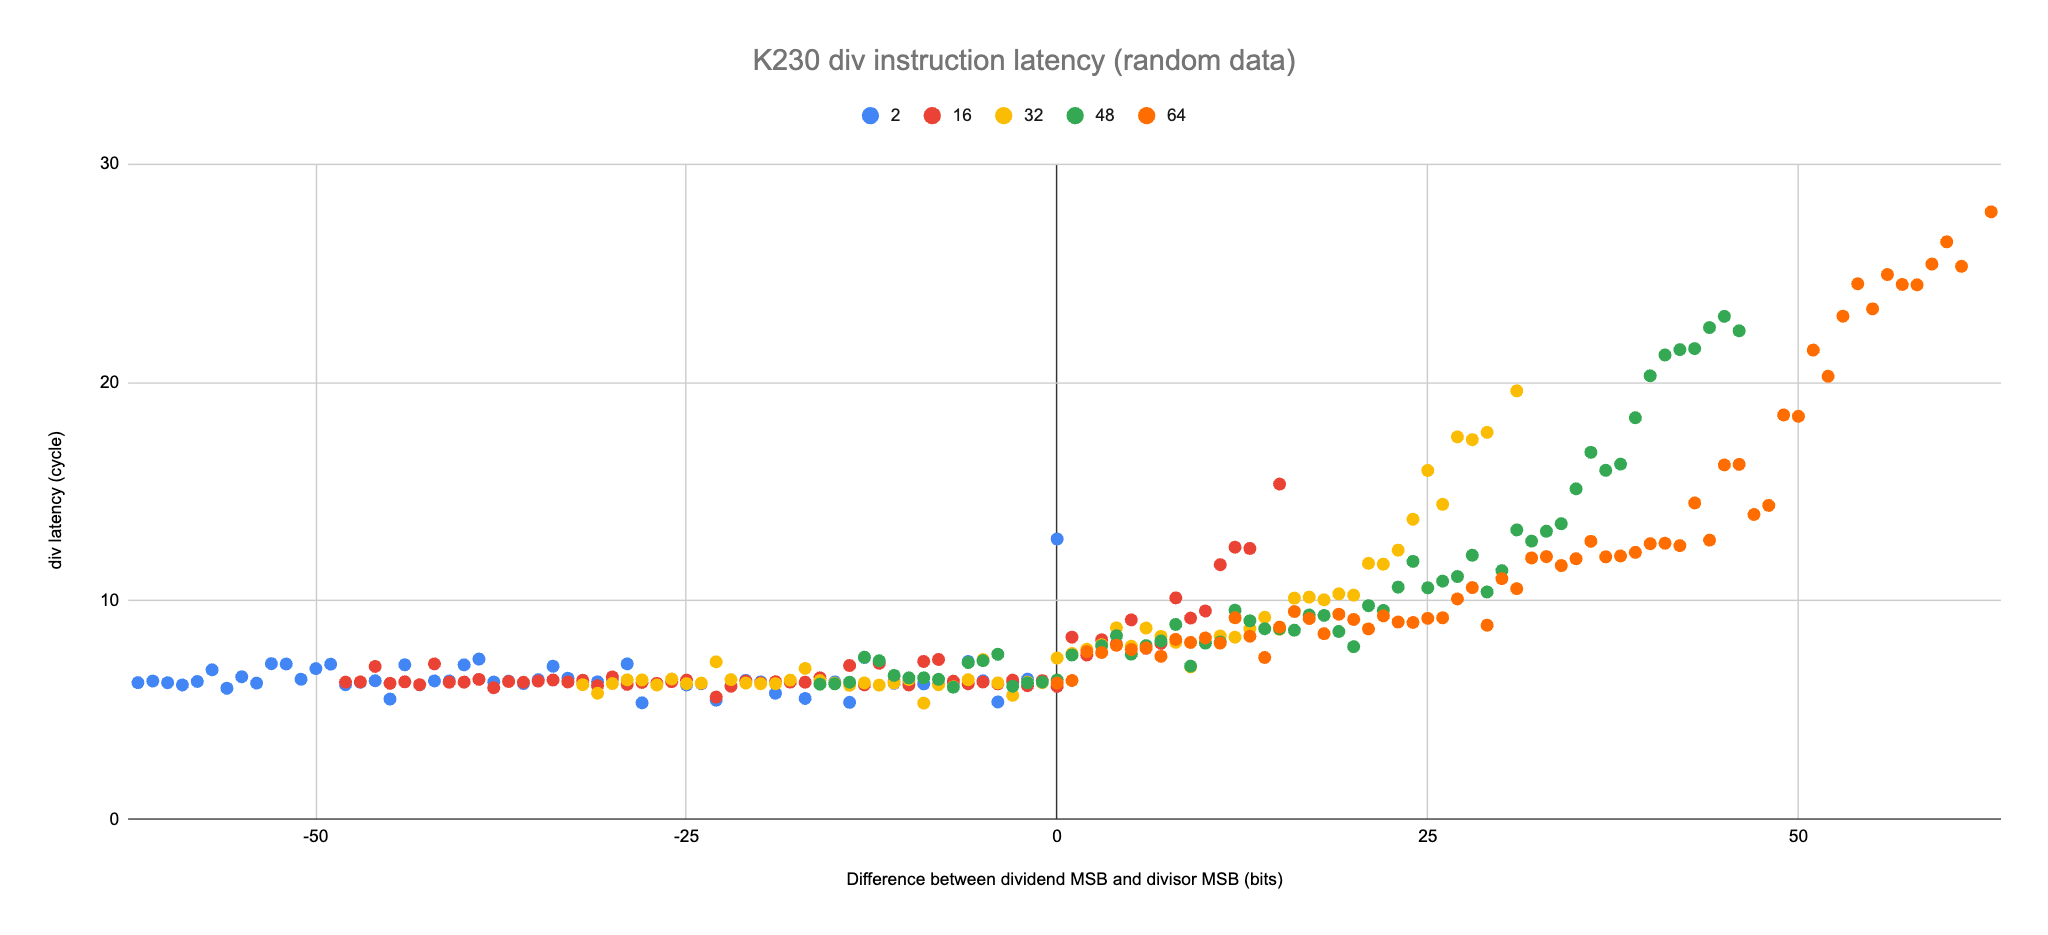
We can clearly distinguish multiple parts:
for negative delta (the divisor is larger than the dividend) the latency seems constant and hovers around 6 cycles. The result is always zero in that case and the actual values of dividend and divisor seem irrelevant.
for positive delta (the dividend is larger than the divisor) the latency grows with the value of delta. The growth is not uniform and it looks like for each size of divisor three sub-areas appear: a slow growing latency when delta is small and then a faster growing latency for the largest values of delta.
Let’s look a the results for a specific divisor value: 3.
For each possible dividend width (or position of the dividend most significant bit a.k.a. MSB), 9 random values of that bit width were generated. The divisor is always 3.
If we reduce the number of values per width, we get:
A (very noisy) pattern appears: the latency seems to increase by one cycle when the dividend width increases by 4 bits. The slope would be compatible with a Radix-16 divider implementation: the divider would produce 4 bits per cycle.
Scalar instruction throughput
Another interesting metric is the throughput of each instruction: how many instruction per cycle can the micro-architecture sustain when they are no direct data dependencies between the instructions. This measures several aspect of the micro-architecture: the execution width of the execution stage and also its capabilities to feed its execution pipeline(s). In particular, it is a good indicator whether the function unit(s) for a particular operation are fully pipelined (or iterative in nature).
Two complementary metrics can be used for the throughput:
Cycle Per Element (CPE): the average number of cycles it takes the micro-architecture to produce a result. The lower, the better.
Element Per Cycle (EPC): this is simply the reciprocal of the CPE and indicates how many element(s) on average the micro-architecture can produce every cycle. The higher, the better.
To measure throughput, we need to build a micro-benchmark which calls as many instruction without dependencies as possible: this can be done by using different inputs and outputs registers (to avoid execution stall due to read-after-write [RaW], write-after-write[WaW], or write-after-read dependencies[WaR]). Micro-architectures which implements register renaming will get rid of WaW and WaR dependency on their own but RaW is part of a program true dependency graph. In the case of an in-order machine with identical operation latency, WaR and WaW are less of an issue, but unwanted RaW must be avoided to ensure instructions are executed as soon as there is a functional unit available and are not waiting on a data dependency.

Note: this widget is not without default. Eventually (every iteration or 13 operations) it exposes a WaW dependency. For a very agressive (very wide or optimizing unused writes) micro-architecture the measurement could be skewed.
The following plot presents throughput measurement for some scalar instructions. To add to the confusion, :-), we have presented both CPE and EPC on the same graph. CPE uses the left vertical axis and is plotted in blue; EPC uses the right vertical and is plotted in red, the vertical axis scales differ.
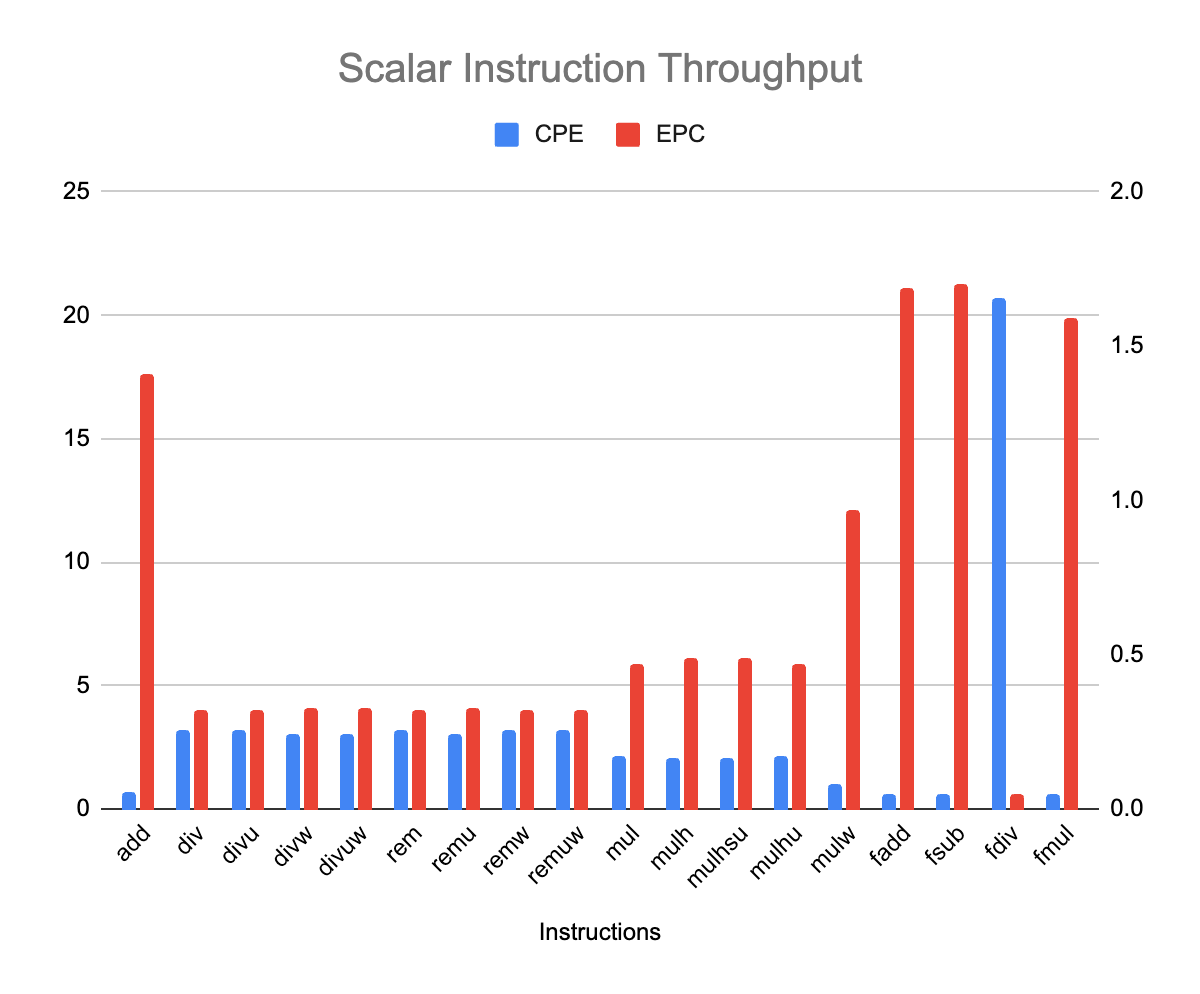
A few standard operations, such integer add and floating-point fadd, fsub and fmul expose a higher throughput, close to 2 instructions per cycle (or one result every half cycle). Those operands exposes different latencies. Integer multiply and its derivatives exposes a throughput close to one instruction per cycle. It seems that the K230 core micro-architecture has twice has many floating-point unit (for FADD, FSUB, FMUL) as it has integer multiply unit(s).
Side Note: Memory benchmarking
I started with a trivial `memcpy` benchmark: copying a source buffer to a destination buffer. The results were a bit disappointing: it does not seem like the micro-architecture can get past a few bytes per cycles; and never actually get close to just even 8 Bytes per cycle, whatever the buffer size. Since the micro-benchmarks work by transferring back and forth the data between the same two buffers, I was expecting that the smaller size would eventually fit completely into at least one of the cache levels and would exhibit higher throughput when repeated. But it does not look like smaller transfers are any faster than the larger ones. Conversely, larger transfers could offer more opportunities to hide memory access latency (by anticipating so many loads that the latency would be hidden) but this does not seem to be the case neither.
:-(
To be revisited.
Benchmark: simulation versus reality
In this section we are going to revisit a previous post:

Our goal is to compare the results we got then (“benchmarking” on a simulator without an accurate performance model) to what we get on real hardware. To make for a fair comparison, we re-run the simulation results to use the same compiler in both cases (and the same compilation options).
Spike (instruction set simulator) result’s:
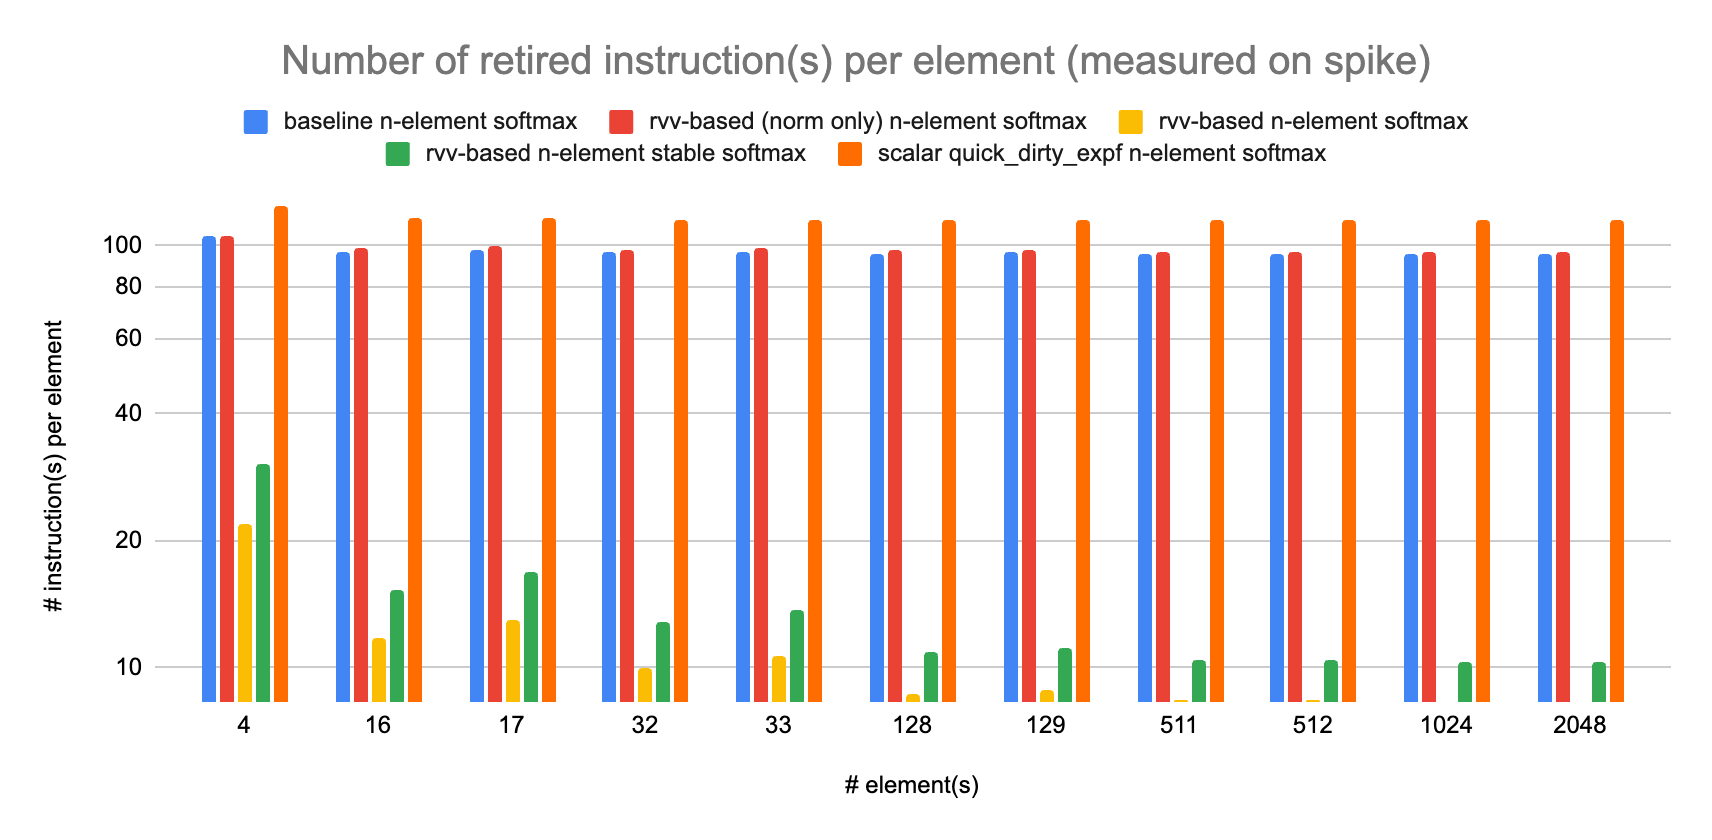
Real hardware (K230) result’s:
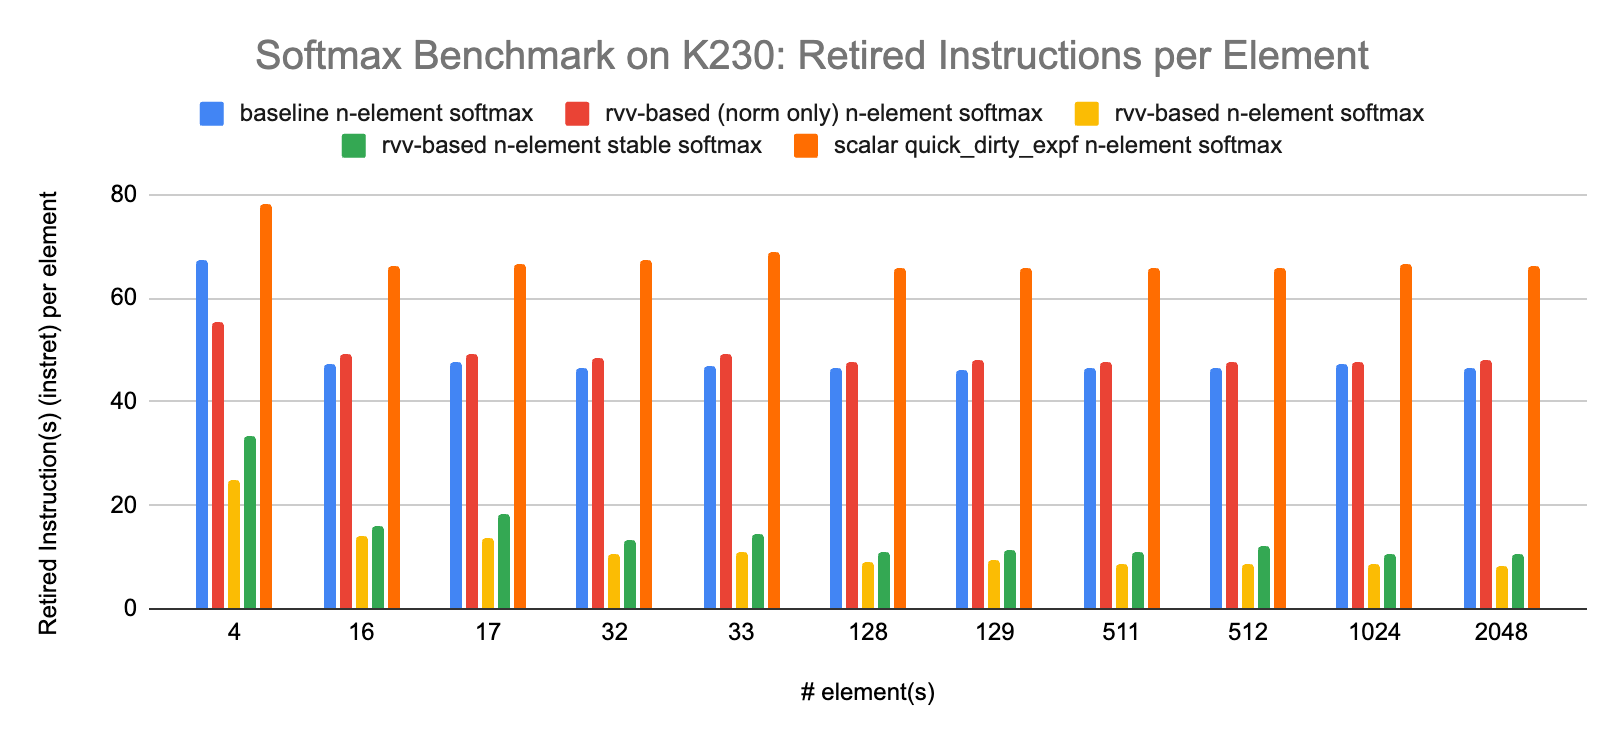
The numbers of retired instructions differ, but this is more a sign of toolchain than hardware capability. The compiler in the RISE development image for the K230 is able to generate less instruction(s) per element than the compiler used on the original softmax post. With the same toolchain and same input data (e.g. hardware or simulator bug[s]) we would expect the same number of retired instruction(s) since this is only a function of the binary program and the input data. The trend between the various variants of softmax seems to hold, with the rvv-based n-element (stable) softmax exhibiting the less instructions per element and the scalar quick and dirty variant exhibiting the most.
Let’s now look at actual latency measurements on the K230:
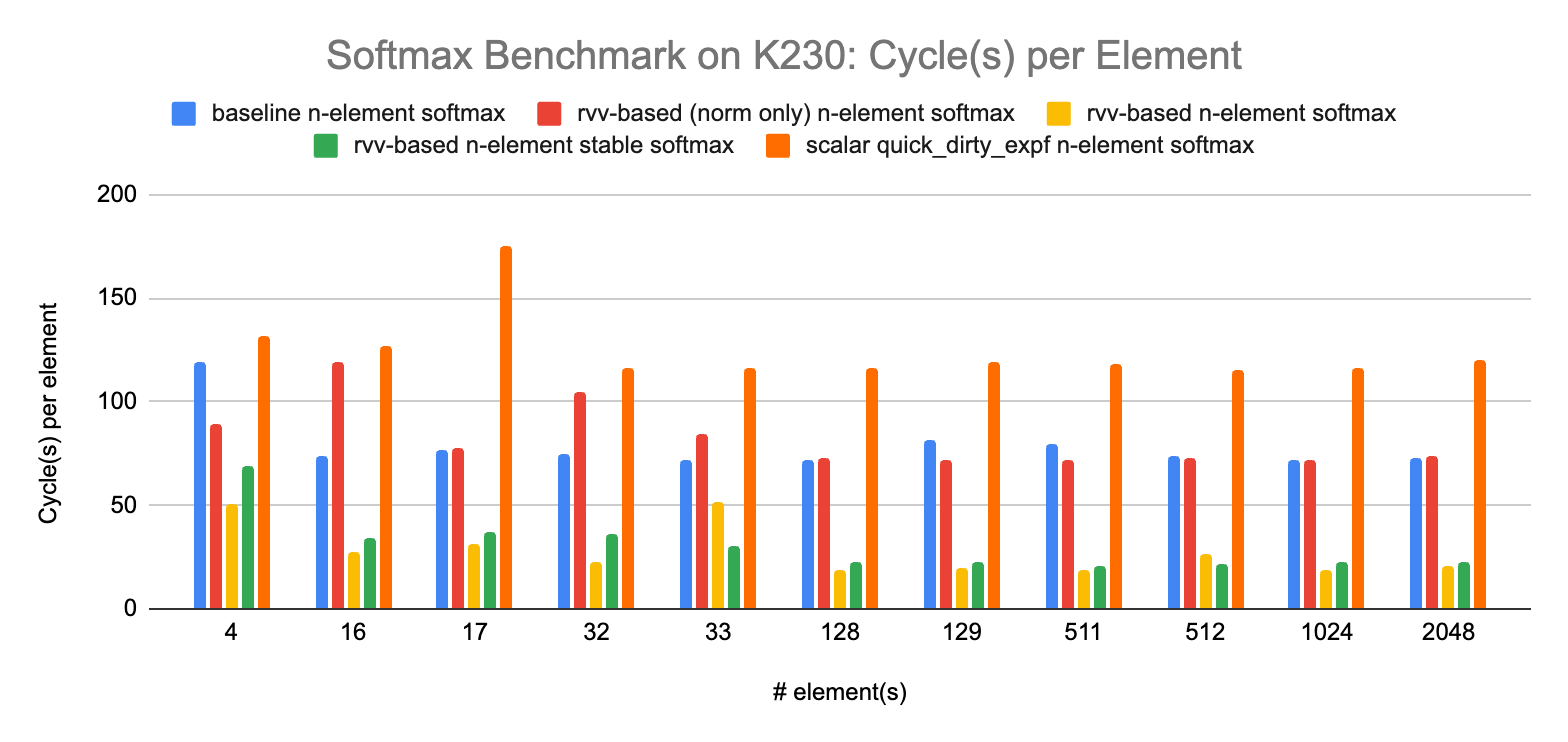
The overall order stays the same with some local variations. It is interesting to see that the measurement of the number of retired instruction(s) on an instruction set simulator (ISS) is actually a rather good proxy for the latency on real hardware. Our Softmax implementations are mostly made of arithmetic operations (they do not appear memory bound on the test platform, and since they do not rely on large look up table that would not fit into the lower cache levels, they are not that sensitive to memory latency). For this type of workload, vector performance is often highly correlated with the number of instructions (vectorization allowing to execute as many instructions in parallel as the micro-architecture can accommodate, assuming the input array is large enough to fill the execution pipelines).
Conclusion
I hope this (micro) benchmarking exercise has given you an idea of some of the K230 (very) low-level capabilities (or a taste for [micro]-benchmarking). We have covered some basics of micro-benchmarking, including our dummy widget for scalar latency measurement and the importance of data value in some latency measurements.
The results presented in this post remain very noisy and partial and micro-benchmarking is a perilous exercise, often not providing that much insight into how to predict the behavior of a real workload.
made a very comprehensive benchmarking of the C908 core in the K230 including vector operations: https://camel-cdr.github.io/rvv-bench-results/canmv_k230/index.html.References
Source code for the micro-benchmarks: https://github.com/nibrunie/rvv-examples/tree/v0.3.0-ubench
https://riscv-europe.org/summit/2024/media/proceedings/plenary/Wed-11-45-Nathan-Egge.pdf
RISE’s project wiki on development image: https://wiki.riseproject.dev/display/HOME/RISC-V+Developer+Environment
- ‘s K230 benchmark page: https://camel-cdr.github.io/rvv-bench-results/canmv_k230/index.html
Linux perf event API: https://man7.org/linux/man-pages/man2/perf_event_open.2.html
camel-cdr’s comment on accessing perf counters on RISC-V (Linux)
Some efficient low energy/low footprint implementations may even implement iterative multiplication and/or shift shift operations. This makes them unfit for Zkt.
Fprox, interesting, as usual.
Question:
In your chart of K230 scalar latencies, you show fdiv.d having a latency of 8 cycles, which seems implausible if fmul.d is 6 cycles and div is 25 cycles. It might be possible if it's divide-by-zero or divide-by-power-of-2, but not in general unless it's a completely unrolled Newton-Raphson implementation. (That would be a lot of gates for this CPU, and a bad tradeoff for gates vs. latency vs. how often the instruction is used.) Can you clarify this?
It's a great article and very structured analysis.
As I'm new on the topic, I would like to understand better if there is a latency difference between 32-bit vs 64-bit floating point (for example fmul.d vs fmul.s).
Did you bench the load and store instruction on 32-bit and 64-bit floating point ?